
Servers monitoring UI proposal

In the young industry which is software development, most domains are filled with applications made by developers with no thoughts about the end users. Bulletin boards, for instance, were an excellent example of terrible, unacceptable user experience, until Discourse was released.
Servers monitoring is another domain where the lack of thought about user experience and the lack of any creativity from the persons who develop the monitoring software is rather impressive. This is not their fault: most of those software products were developed under time pressure and extremely low budget; I can imagine that many of those products were drafted by system administrators during a few free hours per week they could get from their hard work.
Products such as Nagios were completely unable to evolve their user experience over time. Those products are still presenting themselves as simple lists with a bit of color, the only slightly graphical elements being charts. This makes it difficult to work with those products, and practically impossible to visualize information properly.
This constrains the usage of those products to active regular checking. In other words, in most companies, persons in charge of the monitoring are checking the statuses of servers once or twice per day. The remaining time, they do something other, and rely exclusively on the alerts in a form of emails sent to them by the monitoring software (given that they may .
Thus, passive constant checking doesn't exist. What I mean is that persons in charge of the monitoring don't have dedicated displays which show in nearly-real-time what is happening. By not having proper visualization capability, we are losing the opportunity to easily spot a problem before it starts affecting the infrastructure.
Bubbles concept
Welcome to the concept of bubbles. Instead of representing a machine as a line, each machine corresponds to several bubbles appearing close to each other.
The following draft shows the concept applied to a sample machine:
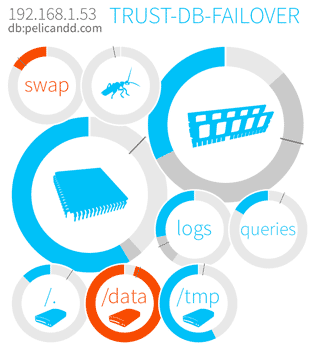
If we assume that CPU and memory usage are the most important metrics for this particular machine, those two entries will appear twice larger than others. Actually, the concept can be pushed even further with the dynamic size of the bubbles: when the system thinks that the reported metric may indicate that something is not right, the bubble may grow on itself to attract the attention of the personnel.
Every bubble contains:
The circle which can display up to two values. For example, a memory bubble can display memory usage excluding caching (in blue), but also including caching (in dark gray).
The red limit, displayed as a line. When the value displayed in blue reaches this line, the bubble is displayed in red. This is an early indication that something goes wrong. For example, for a partition, a red line may be set at 90% of the total disk space to prevent going out of space.
The content, which may be either a icon or text or both.
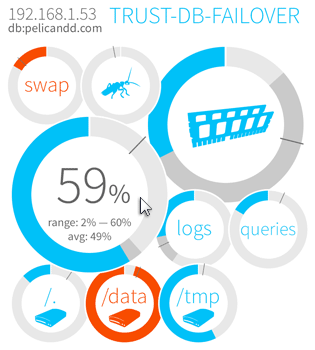
Absolute values can be obtained by hovering a cursor over a bubble. Additional information may (and probably will) be displayed as well.
The bubble-based layout ensures that the overall picture of the infrastructure is visually reachable, given enough monitors. At a glance, any person can determine if there is a problem, and if yes, localize it with ease.
Aggregation
Simply displaying individual information for every machine is not enough. This approach works well when managing a few hundreds of servers, but how would anyone visualize information arriving from thousands of servers?
Existent products do nothing to solve this issue, using only the most elementary indicators, such as the number of servers which report errors. However, solving it is not particularly difficult.
When it comes to visualizing a single metric, such as the use of swap, a simple visualization could look like that:

Every machine corresponds to a dot; the size of the dot is proportional to the metric, and the red color indicates that a threshold (for this specific metric on this specific machine) was reached. This allows to view thousands of elements at once and to spot how many are problematic.
But the primary goal, when managing thousands of servers, is not to view the same type of metric for thousands of servers, but rather view all the metrics. This is when comes the aggregation approach. Two or more machines are grouped together based on an element, such as their type, to appear as a monolithic entity which uses the same space as a single machine used before aggregation. The bubbles can then be customized to allow different types of aggregations: a maximum, a minimum, an average value or separate values shown by the same bubble. The following image illustrates such aggregation of five machines, the CPU bubble showing separate measures.
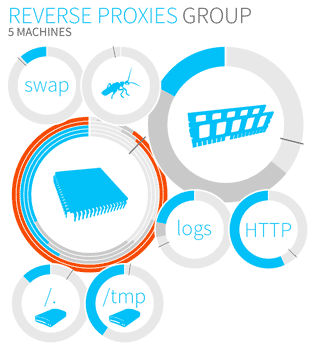
Aggregation is a powerful tool which makes it possible to get real-time data from thousands of servers. For instance, machines which serve as database failover for applications of similar type can all be aggregated, since their usage is similar. In the same way, servers which process data in a map reduce scenario can be aggregated as well.
I explained how the concept of bubbles helps in visualizing metrics gathered from dozens of servers as well as from thousands of servers. This new user interface proposal can be embedded into existent products to make it possible for system administrators to achieve higher responsiveness by having better tools which give them the right amount of data in a very natural way.
For those of you who work closely with servers monitoring tools, feel free to talk to the companies who develop those tools to see how can they benefit from the concepts of bubbles and aggregation.