Scripting languages, automation and productivity
I remember Pragmatic Programmer book encouraging to use plain text, and what could be more powerful than Linux shell and a scripting language to work with text in order to transform it?
That's why when a colleague asked today how he can transform an Excel table to a format similar to:
+-------------------------------------+---------+
| Product                             | Price   |
+-------------------------------------+---------+
| Dell PowerEdge R320                 | 1429.00 |
| Dell PowerEdge R730xd               | 2509.00 |
| PowerVault MD3 Serial Attached SCSI | 6282.70 |
+-------------------------------------+---------+
I immediately thought about Python, and also about a library which I use in Solange.
So I gave the link to my colleague, but then I retracted it: it appeared that the task was to export a small table, and dive into a third-party library to do the task which is fast to do by hand seems an overkill.
I thought it was still interesting to know how much is this an overkill. So back home, I did the actual test. The results were both impressive and exciting.
Preliminary work
Unsurprisingly, the hardest part was to prepare the sample data. Obviously, it made no sense to load the Excel file directly in Python, so the first step was to create a CSV file. Strangely, numbers were not real numbers and were exported with strange leading and trailing whitespace and even stranger quotes, and since I know nothing about Excel, it took me several minutes to find how to specify that numbers are actually numbers.
Once the file was created and moved to a directory, the second step was to create the Python script itself and to download the library:
touch sample.py
chmod +x sample.py
svn co http://source.pelicandd.com/infrastructure/createvm/app/table/
vi sample.py
Great. Few seconds after beginning, we are ready to write the script.
Writing the script
The script couldn't be simpler. We basically need to import CSV data and feed the Table class with it:
#!/usr/bin/env python

import csv
import table

with open("SampleData.csv") as f:
    reader = csv.reader(f)
    print(table.Table(next(reader), reader).display())
The fact that the first's Excel row contains the names of columns is very handy. Given that Table requests two arrays: the names of columns and the contents, we simply feed the names with next(reader), which also moves the cursor to the second row.
Unfortunately, the library is not architected very well. The bad thing is that it has an ugly dependency on colorize. My first reaction was to remove the dependency by altering the code, but I lost time to do that. In retrospective, I think I could do better by downloading the file as well.
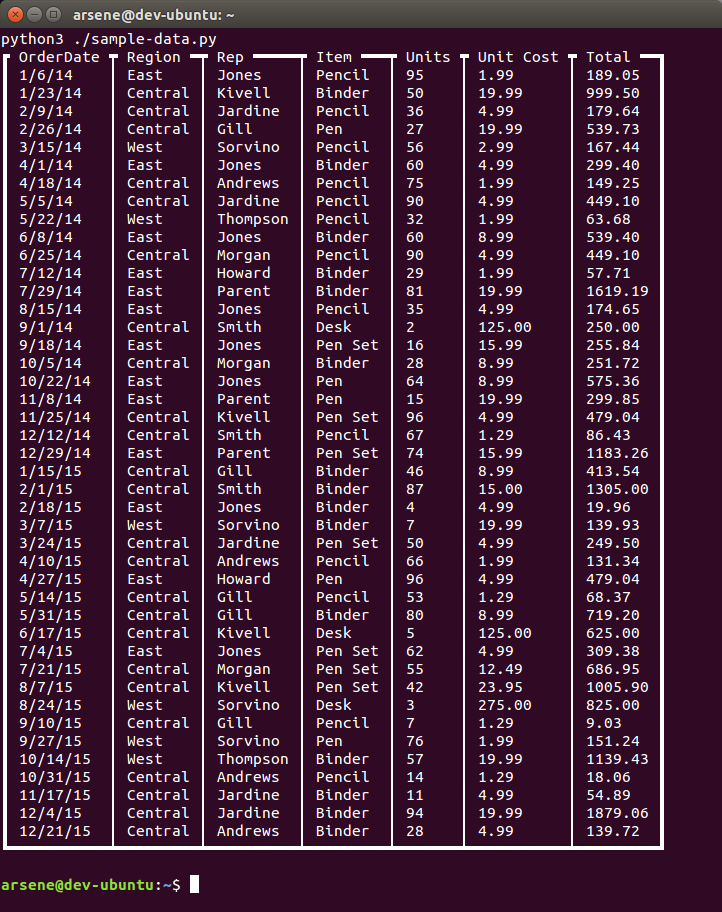
This is what I get as a result:

Close enough, but we can do better.
One of the ways to do better is to use sed. With a simple:
python3 ./sample-data.py \
    | sed -r 's/[┃│┏┯┓]/|/g' \
    | sed 's/━/-/g' \
    | sed -r 's/[┗┷┛]/+/g'
we end up with:
| OrderDate | Region -| Rep -----| Item ---| Units | Unit Cost | Total --|
| 1/6/14    | East    | Jones    | Pencil  | 95    | 1.99      | 189.05  |
| 1/23/14   | Central | Kivell   | Binder  | 50    | 19.99     | 999.50  |
| 2/9/14    | Central | Jardine  | Pencil  | 36    | 4.99      | 179.64  |
     ⋮         ⋮        ⋮         ⋮      ⋮       ⋮           ⋮
| 11/17/15  | Central | Jardine  | Binder  | 11    | 4.99      | 54.89   |
| 12/4/15   | Central | Jardine  | Binder  | 94    | 19.99     | 1879.06 |
| 12/21/15  | Central | Andrews  | Binder  | 28    | 4.99      | 139.72  |
+-----------+---------+----------+---------+-------+-----------+---------+
(result shortened to improve readability)
Not bad at all. We can actually work with that. But we can do better. The first line is expected to be the same as the last line, which can be shown with python3 ./sample-data.py | tail -n2 | head -n1 (excluding sed). Also, the current first line—the one which contains the names of columns, should contain spaces instead of dashes. This means that the command should be modified like this:
python3 ./sample-data.py | tail -n2 | head -n1 \
    | sed 's/━/-/g' \
    | sed -r 's/[┗┷┛]/+/g'

python3 ./sample-data.py | head -n1 \
    | sed 's/━/ /g' \
    | sed -r 's/[┏┯┓]/|/g'

python3 ./sample-data.py | tail -n2 | head -n1 \
    | sed 's/━/-/g' \
    | sed -r 's/[┗┷┛]/+/g'

python3 ./sample-data.py | tail -n+2 \
    | sed -r 's/[┃│┏┯┓]/|/g' \
    | sed 's/━/-/g' \
    | sed -r 's/[┗┷┛]/+/g'
That's a bunch of spooky scary seds we have here! At least we have the expected result:
+-----------+---------+----------+---------+-------+-----------+---------+
| OrderDate | Region  | Rep      | Item    | Units | Unit Cost | Total   |
+-----------+---------+----------+---------+-------+-----------+---------+
| 1/6/14    | East    | Jones    | Pencil  | 95    | 1.99      | 189.05  |
| 1/23/14   | Central | Kivell   | Binder  | 50    | 19.99     | 999.50  |
| 2/9/14    | Central | Jardine  | Pencil  | 36    | 4.99      | 179.64  |
     ⋮         ⋮        ⋮         ⋮      ⋮       ⋮           ⋮
| 11/17/15  | Central | Jardine  | Binder  | 11    | 4.99      | 54.89   |
| 12/4/15   | Central | Jardine  | Binder  | 94    | 19.99     | 1879.06 |
| 12/21/15  | Central | Andrews  | Binder  | 28    | 4.99      | 139.72  |
+-----------+---------+----------+---------+-------+-----------+---------+
A much better alternative is to tell to Python what we need in the first place, which is very easy with the table library. The library is based on formatting files which define exactly how the table will be displayed. There is a formatting class for nearly borderless table, and complex formatting classes which rely on color, but not what we need—a simple text table with “+,” “-,” and “|.”
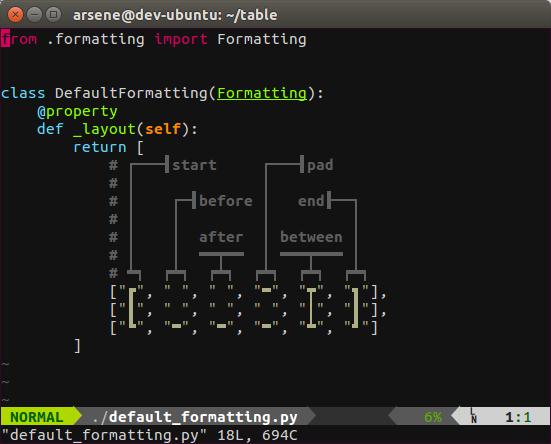
Let's create one. The default formatter looks like this:

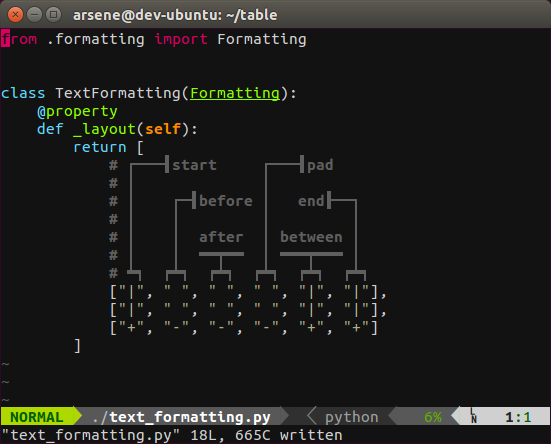
By copying it as text_formatting.py and modifying it like this:

and the original source code like this:
#!/usr/bin/env python

import csv
import table

with open("SampleData.csv") as f:
    reader = csv.reader(f)
    layout = table.Table(next(reader), reader)
    text = layout.display(formatting=table.TextFormatting())
    print(text)
we obtain:
| OrderDate | Region  | Rep      | Item    | Units | Unit Cost | Total   |
| 1/6/14    | East    | Jones    | Pencil  | 95    | 1.99      | 189.05  |
| 1/23/14   | Central | Kivell   | Binder  | 50    | 19.99     | 999.50  |
| 2/9/14    | Central | Jardine  | Pencil  | 36    | 4.99      | 179.64  |
     ⋮         ⋮        ⋮         ⋮      ⋮       ⋮           ⋮
| 11/17/15  | Central | Jardine  | Binder  | 11    | 4.99      | 54.89   |
| 12/4/15   | Central | Jardine  | Binder  | 94    | 19.99     | 1879.06 |
| 12/21/15  | Central | Andrews  | Binder  | 28    | 4.99      | 139.72  |
+-----------+---------+----------+---------+-------+-----------+---------+
No need for sed any longer:
python3 ./sample-data.py | tail -n2 | head -n1
python3 ./sample-data.py | head -n1
python3 ./sample-data.py | tail -n2 | head -n1
python3 ./sample-data.py | tail -n+2
Fast, faster, fastest
Now the results:
| Task | Duration (min:sec) |
|---|---|
| Time to find an Excel spreadsheet and export it as CSV | 4:20 |
| Create the original script and modify the library | 1:50 |
Write original bash with unreadable seds |
3:10 |
| Create a formatter for the library | 2:40 |
| Optimal path from a CSV file to the final solution | 4:30 |
Personally, I'm impressed by the results. Less than five minutes create a script which processes the CSV file and outputs it according to the required format is a much shorter time lapse than I would expect.
If the Excel file contains three rows and three columns, it's obviously faster to do the task by hand. But for any average file, scripting appears an attractive alternative. Do I need to mention the fact that the script can be reused?
I was cheating
While the results are interesting, I should mention that I cheated. They are true: I actually measured the time it took me to do the task. But the context in which they were measured have nothing to do with the context of my colleague.
When measuring the time it takes to perform those tasks:
I wasn't under pressure. While I was trying to do those tasks as fast as possible, there was no environmental pressure. I could have completely failed the task, and it wouldn't bother me much. My colleague, on the other hand, was probably doing a job for a customer who was expecting results, and expecting them soon.
I was in a calm environment. Not in an office. Slightest noise has a huge impact on productivity, and I wouldn't be surprised that it takes twice as much time to perform the same task in a noisy environment.
I was in an environment designed for productivity. Two large monitors, excellent keyboard, comfortable chair. I don't think this has the same effect as a quiet environment, but still, performing the same task in a different environment is not that easy.
I used Linux. This means that I had Python, and I had
bash. And that alone is a huge benefit. My colleague had Windows. Installing Python would take minutes. Figuring out how to format the output similarly tosedwould take minutes too. I'm sure PowerShell has similar capability, but not knowing PowerShell well enough, I would have failed the task miserably.And finally the most important point: I knew the
tablelibrary. I designed it. Having to discover the library for the first time will take minutes, and trying to understand how to modify it will take time as well. On the other hand, I knew exactly how to use and extend it for the purpose of the test.
