
Introducing... a pen

In most projects, sooner or later, someone asks himself which tool should be used to make diagrams. It may be that the team wants to document their architecture, or explain something to a customer, or... whatever. Long story short, one needs to do a drawing which will be incorporated into a document such as a Wiki or a readme or a simple PDF explaining a concept.
When the subject is brought to a meeting, everyone starts suggesting their favorite tool. Some suggestions such as Adobe Illustrator or draw.io apply to virtually every situation; others are more generic, and a tool which is specifically designed for UML sequence diagrams will hardly help when you need to draw a schema explaining an architecture of a component. Some tools are paid; others are free. Some of them require months of learning. For others, the user may be quite efficient within minutes.
But all those tools are missing a point.
The primary goal of a diagram is to show a thing which would be rather difficult to explain with words. UML's use case diagrams or activity diagrams or even sequence diagrams can all be described through text, but those diagrams are able to visually transmit information much more effectively. Often, a glimpse on a diagram is enough to understand what's going on, while the transcript of the diagram would take a bunch of paragraphs, if not the whole page.
The secondary goal, for a developer, is to be able to create the diagram in a short amount of time. While it is true that documentation, when read, is read much more times than it's written, it doesn't mean that spending hours on a diagram would benefit the team—and so the company.
How do different tools respond to those goals?
When it comes to the first goal, there is little difference between those tools—it's rather the job of the person who designs a diagram to think about a way to make the diagram explicit and self-explanatory.
If specialized tools have the benefit of forcing the user to comply with the given rules (which can be really confusing when it comes to UML!), they could also divert the attention of the user from the goal itself, by putting too much focus on a specific type of the diagram, while another one could be much more expressive.
I also noticed that users of any tools, including the ones which are expected to be easy to use even for newbies, are too afraid to experiment with different ways of expressing the same concept. They stick with their original idea, and focus on realization, i.e. the color and shadow of the blocks, the weight of the arrows, etc. While those are all important aspects, it's easy to miss the fact that the whole thing is plainly wrong.
If for the first goal, different tools could hardly be compared, things should be radically different when it comes to the second goal, since those tools were specifically built with productivity in mind. Ideally, the tool which is the simplest and fastest to use will win—given that designing a tool which responds to every possible use case is virtually impossible.
I've tested myself a dozen of different tools, and found that, indeed, without prior experience in any of them, my productivity gap could easily achieve a factor of ten. Learning one of the tools would shift and sometimes increase the gap.
However, with all my respect for simple and intuitive tools which let me do my job and are often available for free, I find them too cumbersome. I always end up spending more time using the tool rather than thinking about my diagram, and I can hardly detach myself from the original idea of what I'm about to do, in order to explore other approaches.
If you encounter the same issue, I have a solution. Let me introduce... a pen.

Figure 1 A pen—a tool to draw diagrams.
Before you start making fun of me, let me assure you, other people did it before. Every time developers start talking about the tool they should use to draw a diagram, I suggest a pen. Every time I make this suggestion, they laugh at me. This is very unfortunate, because my suggestion is all but funny.
Long time ago, I was in school. I enjoyed a lot of things, and one of those things was computers. I loved what a computer can do, and I also loved the fact that with a bit of Word and MathType¹ skills, one could create visually attractive documents when doing homework. My mathematics teacher, however, was of a different opinion. She thought that computers have no place in education, and that homework should be done by hand. And since teachers have usually leverage, while students don't have any, I stopped typing my homework. Since then, I felt in love with LaTeX, and most schools finally started noticing the global shift towards IT. The very same shift seemed to de-emphasize the convenience of a pen as a tool for writing and drawing things. In companies, its usage was de facto limited to drafting something ugly while explaining a concept to a colleague.
What we are forgetting is that a pen remains an excellent tool for creating diagrams. Not drafting, but actually creating the ones which can be embedded in documentation.
I did it myself on several occasions. My major experience was a few years ago when I was in charge of the design of a new product. Since there were many new things, explaining what's going on was crucial so that developers could clearly understand how the product will work. So I did a lot of documents with a lot of diagrams, nearly all of them made by hand. Integrated as illustrations, they were of a great help, and they looked “professional” enough, while taking practically no time at all. Some were small, limited to illustrating a tiny part of the system. Others filled a whole page. In half a dozen other projects, I also found an opportunity to incorporate hand-made diagrams, and every time, the result was a nicely illustrated document.
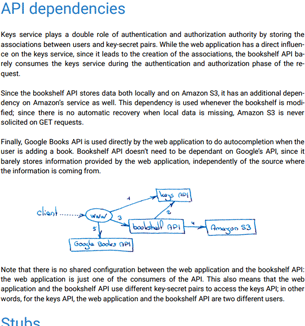
Figure 2 Example of a drawing in documentation.
The time needed to create those diagrams is rather impressive. I spent from less than a minute to thirty minutes on each diagram, including the failed attempts. In many cases, doing the same diagrams on a computer would take me a hour or more. While I'm not proficient with Adobe Illustrator, I find myself quite productive with simpler software products, and learning them more will lead to only a slight gain in time.
While I did those diagrams for internal documentation only, other persons don't hesitate to include such diagrams even in books. The ones that I recall are The timeless way of building by Christopher Alexander, and The fifth discipline by Peter M. Senge. Both will gain little if diagrams were to be redone with Adobe Illustrator: the actual clarity could hardly be improved.
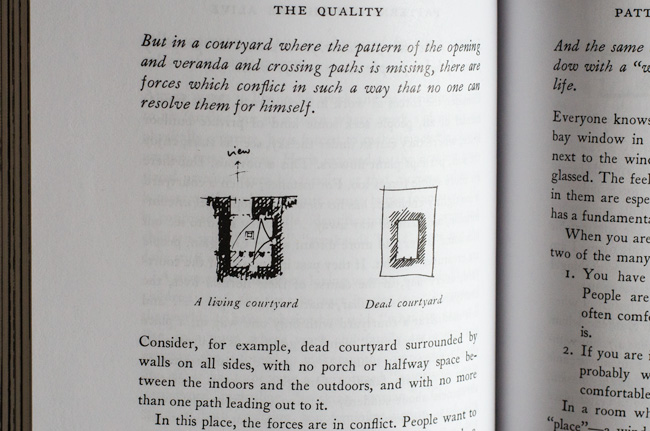
Figure 3 Drawings in a book. The timeless way of building, C. Alexander, page 110.
Beautiful evidence by Edward R. Tufte is worth looking as well. Here, the diversity of illustrations let one wonder how could they possibly be done with even such generic tool as Adobe Illustrator. The astonishing clarity of each drawing makes me ask myself what is going on when I compare them to most diagrams created in the past ten years with all those fancy software products.
While a pen is nothing more than another tool, I believe it has two benefits compared to software-based tools:
- It still provides the fastest way of producing high quality illustrations.
- Instead of emphasizing the tool itself, it makes it possible for the user to keep focus on the actual diagram and how this diagram illustrates a point.
- Corollary of the previous points, a pen makes it very straightforward to explore different options and throw the work when another option seems more appropriate.
This leads to better diagrams, and this is something we all need.