
Pooling and performance: what benchmarks and profiling may reveal

When benchmarking Orseis, I discovered that with repetitive queries, its performance drastically decline. In some conditions, it was more than ten times slower compared to the direct usage of ADO.NET. This is totally unacceptable for a library which claims being super fast, at least fast enough to be implemented in a context where performance does mater. So I started to search what was so terribly wrong which was transforming Orseis into a turtle.
While searching for bottlenecks, it appeared that the poor performance is affecting the whole library, including the part where I simply get a single value from the database (with the same ratio of ten when comparing the speed of Orseis to direct ADO.NET calls). The trick is that getting a single value doesn't involve something potentially slow. There is no Reflection or no up-and-coming between the client and the database.
To my surprise, the issue was the fact that Orseis creates, opens and then closes the database connection on every call, while my implementation of the reference code - the one which used ADO.NET directly, was creating the connection only once.
So I made a benchmark comparing code which reuses the SQL connection and runs a query multiple times and one which recreates the connection for every query. The result: the same ratio of ten in some cases. Very surprising, since MSDN discusses pools but tells nothing about the performance impact of not reusing the connection, and since answers on Stack Overflow are clear: close connections as soon as possible and let the pool do its job (example, another one and another one, etc.)
The following code was used to obtain the result: source code on SVN.
I did sampling for 17 different values, from 21 to 217. For each sampling, I measured two things:
- The time it takes, in milliseconds, to query n times (where n=2x, 1 ≤ x ≤ 17) the database while using the same
SqlConnectioninstance open all the time, - The time it takes to create, open and close the connection n times while doing a single query inside the connection.
The result below illustrates the results for four configurations:
- Running the application from an SSD, not specifying any core affinity,
- Running the application from an SSD, given that the local Microsoft SQL Server Express has the affinity set for core 3 and the application itself has the affinity set for core 2,
- Running the application from an SSD, both the Microsoft SQL Server and the application itself are now bound to core 3, given that the core is then running at 100% during the benchmark,
- Running the application from a hard disk (RAID 1), not specifying any core affinity.
The database is an .mdf file used through a locally installed Microsoft SQL Server Express. The application is compiled in Release mode, compiled for x64 with code optimization enabled. Code contracts are disabled.
The results below don't contain the first sampling, since the metrics are meaningless because of the warm-up of the database.
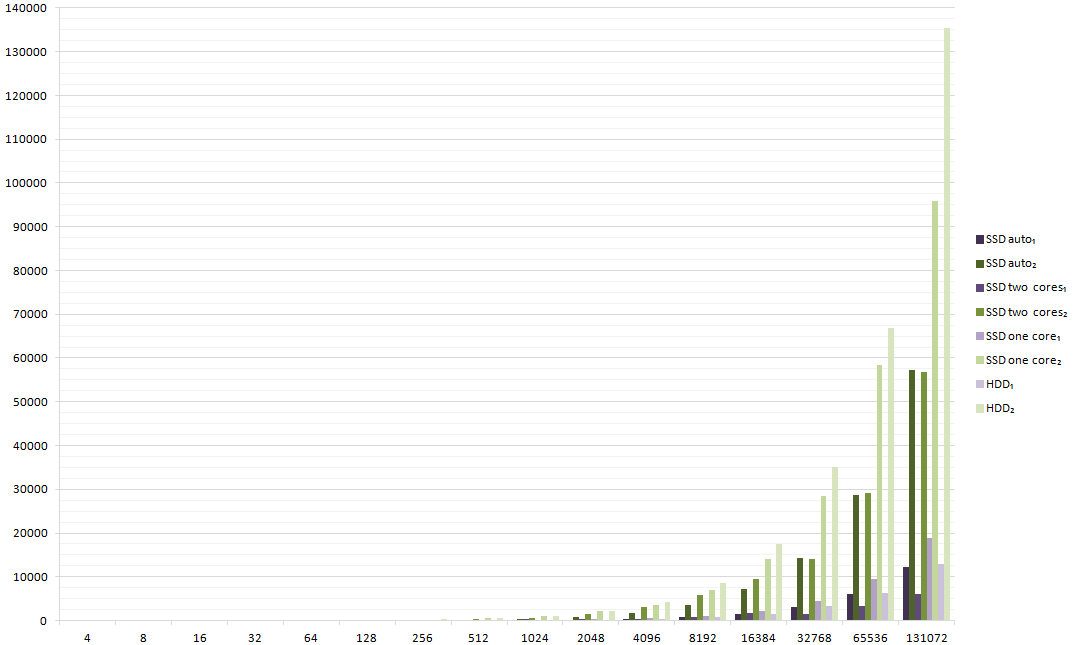
Click for a larger version
Using logarithmic scale, it looks pretty linear:
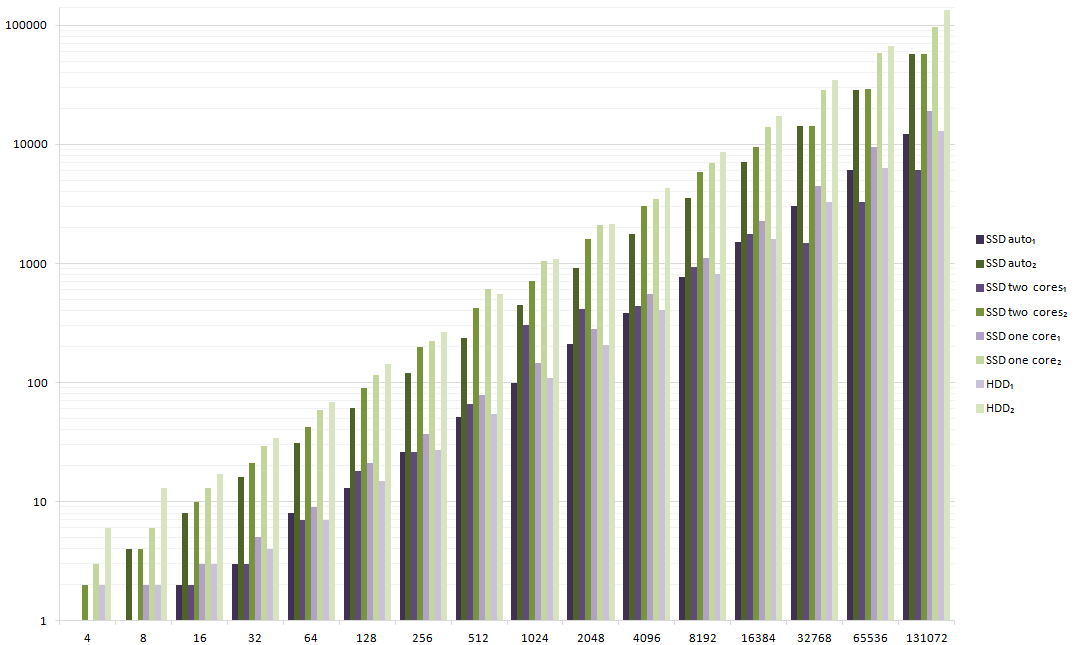
Click for a larger version
Here are the ratios. Recreating the connection decreases performance already at just four consecutive queries and the performance impact becomes much more important when the number of iterations grow. Notice that the disk speed matters, since the performance impact is the most important when testing on a hard disk drive instead of an SSD.
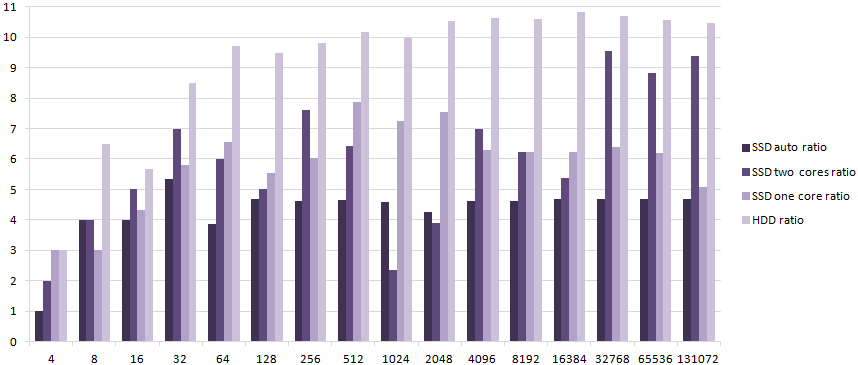
Click for a larger version
What does profiler tell?
Studying the results given by the Visual Studio profiler, it appears that the performance issue is not on System.Data.Common.DbConnection.Open() combined with the connection constructor and Dispose(), but on System.Data.Common.DbCommand.ExecuteScalar(). Curiouser and curiouser!
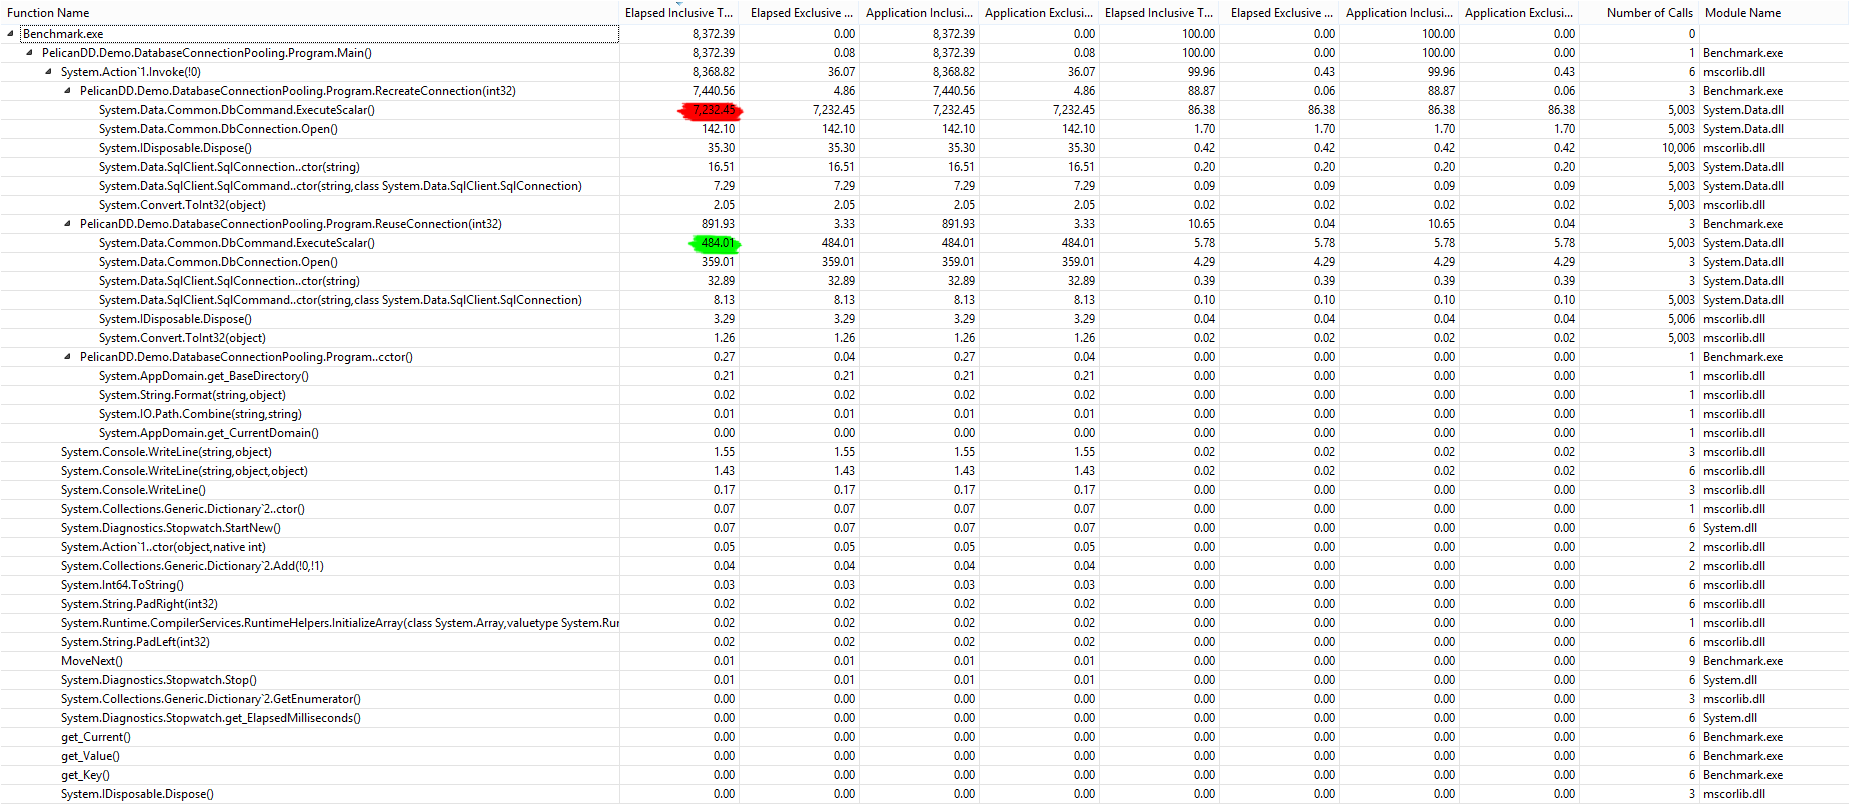
Click for a larger version
The result might have been related to the fact that the command I execute is always the same. The SQL command is identical, and there are no parameters. The fact is that the result is nearly the same if we introduce parameters which change at every iteration, or if the command itself varies inside the loop.
Two possible explanations of those profiler results:
The command could be cached somewhere, somehow, at least partially. In this case, when the connection is reused, the command is reusing those cached resources as well, making it hugely fast.
Another possibility is that connection is inherently lazy. Instead of doing most job when a new instance of the
SqlConnectionclass is created or whenSystem.Data.Common.DbConnection.Open()called, CLR is simply waiting for the first command to do the heavy work.
A simple modification of the original code shows that the second hypothesis is right. When code related to SQL commands is removed, the benchmark for a sample of 5000 is 0 ms. when reusing the connection vs. 90 ms. when recreating it. Compare this to 505 ms. (reusing) and 6 079 ms. (recreating) when actually querying the database.
Conclusion
Connection pooling is great, since it simplifies your life by providing the ability to open connections when you need them and to close them as soon as you don't need them any longer, so they can return to the pool. Using pooling is also a great performance improvement: creating 500 connections takes approx. 600 ms. in the test environment described below when pooling is used, and 4 700 ms. when pooling is explicitly disabled.
This greatness still comes at a cost of performance compared to a code which reuses the same connection, and in some situations, recreating connections can slow the code up to ten compared to the similar code which uses only one instance of the connection.
Does it matter? Sort of. It's not like some personal website will become magically faster just because you started to reuse connections, but it may matter when you have thousands of queries. Results above are showing that even for an amount as small as 32 queries, you may reduce the duration from 34 ms. up to 4 ms., gaining 30 precious milliseconds. In some specific cases, those milliseconds would matter.
Just don't do premature optimization, and don't assume you can easily reuse the same connection in every case. Think about what happens if the same connection is used at the same time from different treads, or about the consequences of keeping the connection, while the connection pool is starving.